How to account for snow in a model?
This example is taken from the Gardenia tutorial [Thiéry, 2013].
This example aims at simulating river flow of the Durance River at Embrun. The Durance River basin, with a drainage area equal to 2170 km², is located in the Hautes-Alpes French department. This basin has a strong snow component. The strongest monthly mean river flow occurs in June due to the snow melting.
The following data are available:
Daily rainfall from 1971 to 2009 in mm/day
Daily potential evapotranspiration from 1971 to 2009 in mm/day
Daily river flow of the Durance at Embrun from 1974 to 2009 in m3/s.
Daily air temperature from 1971 to 2009 in °C.
A simulation starts from 1974-01-01 until 2009-12-31, date of the rainfall data last record. A warmup period from 1971-01-01 to 1973-12-31 initialize the model.
For more information about physical parameters related to snow, see Snow reservoir.
TOML configuration file
[files]
pet = "pet.csv"
rainfall = "rainfall.csv"
temperature = "temperature.csv"
riverobs = "riverflow.csv"
[optimization]
maxit = 450
transformation = "square root"
starting_date = 1974-01-01
river_objective_function = "nse"
[watershed.all]
name = "Durance"
river.area = {value=2170, opti=false}
river.concentration_time = {value=0, opti=true, sameas=0, lower=0, upper=7}
correction.pet = {value=-30, opti=true, sameas=0, lower=-35, upper=35}
progressive.capacity = {value=240, opti=true, sameas=0, lower=0.000, upper=900}
transfer.runsee = {value=30, opti=true, sameas=0, lower=1e-3, upper=9999}
transfer.halflife = {value=5, opti=true, sameas=0, lower=0.05, upper=20}
groundwater.1.exchanges = {value=60, opti=true, sameas=0, lower=-80, upper=70}
groundwater.1.halflife_baseflow = {value=25, opti=true, sameas=0, lower=0.3, upper=35}
snow.correction.temperature = {value=-2, opti=true, lower=-3, upper=3}
snow.correction.rainfall = {value=-20, opti=true, lower=-20, upper=20}
snow.degree_day.coefficient = {value=1.8, opti=true, lower=1, upper=7}
snow.degree_day.temperature = {value=-0.3, opti=true, lower=-2, upper=2}
snow.retention = {value=5, opti=false, lower=1e-3, upper=10}
snow.melting = {value=6.5, opti=true, lower=1e-3, upper=20}
Optimization
import pandas as pd
import matplotlib.pyplot as plt

import rameau as rm

# Load model from a toml file
model = rm.Model.from_toml(f"model.toml")

# Run an optimization with parameters defined in the toml file
sim = model.run_optimization()
# Get the riverflow simulation
riv_sim = sim.get_output("riverflow")
# Get the riverflow observation
riv_obs = model.get_input("riverobs")
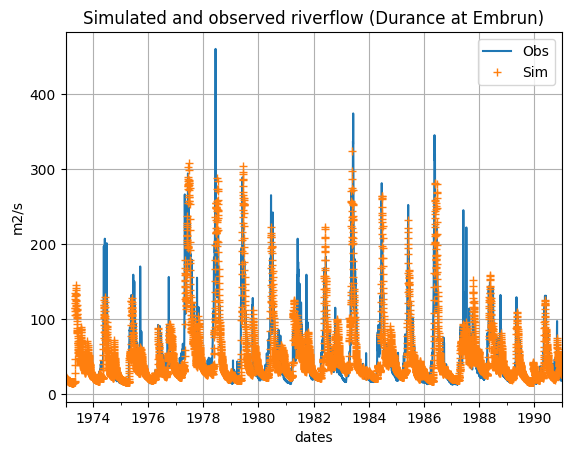
# Plot river flow
df = pd.DataFrame(
{
"Obs":riv_obs.iloc[:, -1],
"Sim":riv_sim.iloc[:, -1],
}
)
df.loc["1973-01-01":"1991-01-01", :].plot(
grid=True,
title="Simulated and observed riverflow (Durance at Embrun)",
ylabel="m2/s",
style=["-", "+"]
)
plt.show()
# Print the riverflow metrics
scores = sim.get_metrics("riverflow")
print(scores)
watersheds      Durance
metrics
nse            0.736330
kge            0.851867
kge_2012       0.858054
nse_sqrt       0.764105
kge_sqrt       0.847495
kge_2012_sqrt  0.847969
nse_log        0.746920
kge_log        0.808830
kge_2012_log   0.804334
ratio          0.976595
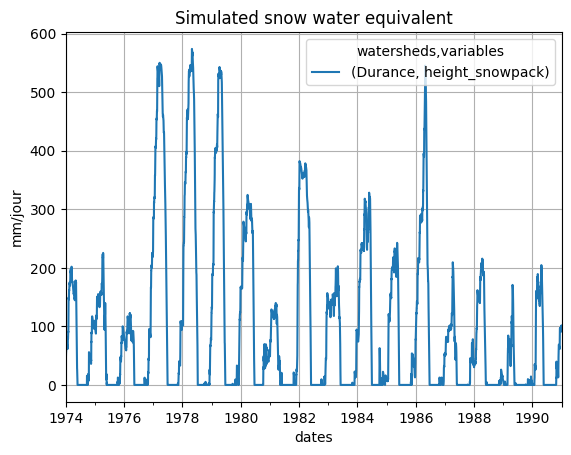
# Get the simulated snow water equivalent.
riv_sim = sim.get_budget(["height_snowpack"])

riv_sim.loc["1974-01-01":"1991-01-01", :].plot(
    grid=True,
    title="Simulated snow water equivalent",
    ylabel="mm/jour",
)
plt.show()