Quick overview
rameau is a Python interface to run lumped or semi-distributed model simulating river flows and/or groundwater levels in a single watershed or a cluster of watersheds.
import rameau as rm
It follows an object-oriented philosophy. The core object is a Model
that can be used for simulation, optimisation, and forecast runs.
To instantiate a Model, the simplest approach is to rely on a TOML
configuration file.
model = rm.Model.from_toml('model.toml')
Simulation
The Model can then directly be used to start a simulation run. It will
use the parameters contained in the TOML file.
sim = model.run_simulation()
This will return a Simulation object from which outputs can be retrieved
as dataframes. The output variables can be riverflow and/or watertable
sim.get_output("riverflow")
| watersheds | basin at gauge |
|---|---|
| dates | |
| 1985-01-01 | 3.732661 |
| 1985-01-02 | 3.724805 |
| 1985-01-03 | 3.717202 |
| 1985-01-04 | 3.709375 |
| 1985-01-05 | 3.701710 |
| ... | ... |
| 2003-07-27 | 5.449160 |
| 2003-07-28 | 5.440802 |
| 2003-07-29 | 5.446587 |
| 2003-07-30 | 5.437758 |
| 2003-07-31 | 5.429577 |
6786 rows × 1 columns
sim.get_output("watertable")
| watersheds | basin at gauge |
|---|---|
| dates | |
| 1985-01-01 | 167.725082 |
| 1985-01-02 | 167.735382 |
| 1985-01-03 | 167.745346 |
| 1985-01-04 | 167.754974 |
| 1985-01-05 | 167.764267 |
| ... | ... |
| 2003-07-27 | 195.042831 |
| 2003-07-28 | 195.015182 |
| 2003-07-29 | 194.987900 |
| 2003-07-30 | 194.960373 |
| 2003-07-31 | 194.932587 |
6786 rows × 1 columns
ax = sim.get_output("riverflow").plot(ylabel='streamflow [m$^3$.s$^{-1}$]')
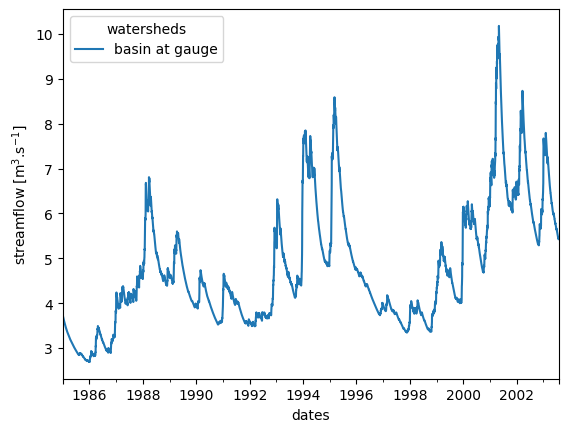
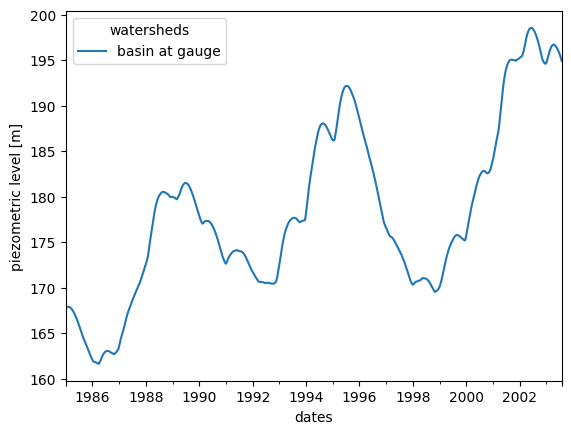
These dataframes can be used to quickly plot the timeseries.
ax = sim.get_output("watertable").plot(ylabel='piezometric level [m]')
Parameter estimation
The Model can also be used to perform an optimisation run to determine the
optimal parameter values that best fit the observed data. It will use
the parameter values available in the TOML file as a starting point, and
optimise the parameters identified as to be optimised in the TOML file.
opt = model.run_optimization()
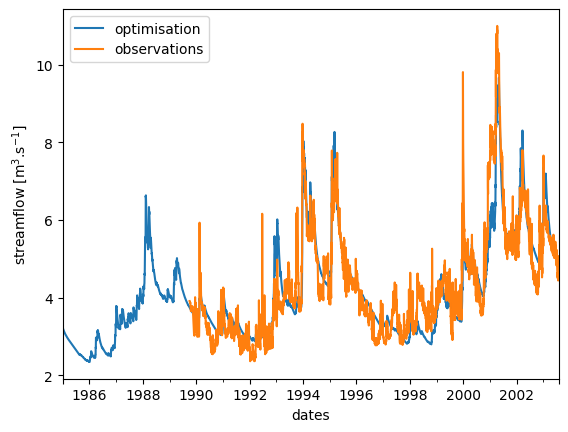
This will return an OptiSimulation object. Again, the outputs can be retrieved from it as dataframes. And so do the observations directly from the Model instance (either riverobs or groundwaterobs).
They can be gathered into a single dataframe and plotted against one another.
import pandas as pd

df =  pd.concat(
    [
        opt.get_output("riverflow"),
        model.get_input('riverobs')
    ],
    axis=1
)

df.columns = ['optimisation', 'observations']
ax = df.plot(ylabel='streamflow [m$^3$.s$^{-1}$]')